Light weight library to Add Marker and draw a circle on open street map
Today I am going to teach you how to draw a circle on Open street Map using leaflet.js library. Leaflet is the leading open-source JavaScript library for mobile-friendly interactive maps.
Leaflet is designed with simplicity, performance and usability in mind. It works efficiently across all major desktop and mobile platforms. For more information visit leaflet.js website
Quick Start Guide
This step-by-step guide will quickly get you started on setting up a Leaflet map, working with markers, popups, and circles.
Preparing your page
Before writing any code for the map, you need to do the following preparation steps on your page:
- include Leaflet CSS file in the head section of your document:
<link rel="stylesheet" href="http://cdnjs.cloudflare.com/ajax/libs/leaflet/0.7.3/leaflet.css" />
- Include Leaflet JavaScript file:
<script src="http://cdnjs.cloudflare.com/ajax/libs/leaflet/0.7.3/leaflet.js">
- Put a div element with a certain id where you want your map to be:
<div id="map">
- Defined height by setting it in CSS:
#map { height: 180px; }
Now start initializing the map and do some stuff with it.
Setting up the map
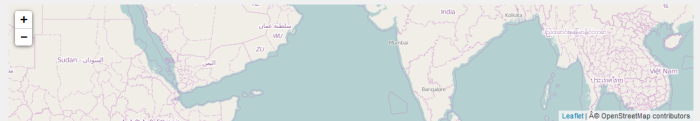
Let’s create a map of the center of Bangalore with OSM tiles. First we will initialize the map and set its view to our chosen geographical coordinates and a zoom level:
var map = L.map('map').setView([12.971599, 77.594563], 12);
By default all mouse and touch interactions on the map are enabled, and it has zoom and attribution controls.Note that setView call also returns the map object-most Leaflet methods act like this when they don’t return an explicit value, which allows convenient jQuery-like method chaining.
Next we’ll add a tile layer to add to our map, in this case it’s a OSM tile layer. Creating a tile layer usually involves setting the URL template for the tile images, the attribution text and the maximum zoom level of the layer:
// add an OpenStreetMap tile layer
    L.tileLayer('http://{s}.tile.osm.org/{z}/{x}/{y}.png', {
        attribution: '© OpenStreetMap contributors'
    }).addTo(map);
Make sure all the code is called after the div and leaflet.js inclusion. That’s it! You have a working Leaflet map now.
Adding Markers and Circle
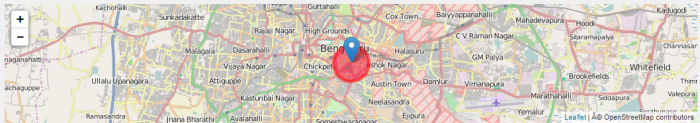
Besides tile layers, you can easily add other things to your map, including markers, polylines, polygons, circles, and popups. Let’s add a marker:
var marker = L.marker([12.971599, 77.594563]).addTo(map);
Adding a circle is the same (except for specifying the radius in meters as a second argument), but lets you control how it looks by passing options as the last argument when creating the object:
var circle = L.circle([12.971599, 77.594563], 500, {
    color: 'red',
    fillColor: '#f03',
    fillOpacity: 0.5
}).addTo(map);
Adding Popup to Marker and Circle
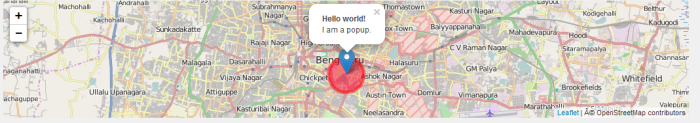
Popups are usually used when you want to attach some information to a particular object on a map. Leaflet has a very handy shortcut for this:
marker.bindPopup("Hello world!
I am a popup.").openPopup();
circle.bindPopup("I am a circle.");
Try clicking on our objects. The bindPopup method attaches a popup with the specified HTML content to your marker so the popup appears when you click on the object, and the openPopup method (for markers only) immediately opens the attached popup.
Complete Code Example
<!DOCTYPE html>
<html>
<head>
<title>Example</title>
<link rel="stylesheet" href="http://code.jquery.com/ui/1.11.4/themes/smoothness/jquery-ui.css">
<link rel="stylesheet" type="text/css" href="//cdnjs.cloudflare.com/ajax/libs/bootswatch/3.3.5/custom/bootstrap.min.css" />
<link rel="stylesheet" type="text/css" href="http://timelib.890m.com/css/style.css" />
<script type="text/javascript" src="https://ajax.googleapis.com/ajax/libs/jquery/1.11.1/jquery.min.js"></script>
<script src="http://code.jquery.com/ui/1.11.4/jquery-ui.js"></script>
                <script type="text/javascript" src="http://cdnjs.cloudflare.com/ajax/libs/twitter-bootstrap/3.3.5/js/bootstrap.min.js"></script>
<link rel="stylesheet" href="http://cdnjs.cloudflare.com/ajax/libs/leaflet/0.7.3/leaflet.css" />
<script src="http://cdnjs.cloudflare.com/ajax/libs/leaflet/0.7.3/leaflet.js"></script>
<style>
#map { height: 380px; }
#map1 { height: 380px; }
</style>

<script>
$(function() {
//This code is for simple Map
var map = L.map('map').setView([12.971599, 77.594563], 12);
// add an OpenStreetMap tile layer
L.tileLayer('http://{s}.tile.osm.org/{z}/{x}/{y}.png', {
attribution: '© OpenStreetMap contributors'
}).addTo(map);

//This code is for Circle
var map1 = L.map('map1').setView([12.971599, 77.594563], 12);
// add an OpenStreetMap tile layer
L.tileLayer('http://{s}.tile.osm.org/{z}/{x}/{y}.png', {
attribution: '© OpenStreetMap contributors'
}).addTo(map1);

var circle = L.circle([12.971599, 77.594563], 500, {
color: 'red',
fillColor: '#f03',
fillOpacity: 0.5
}).addTo(map1);
});
</script>

</head>
<body>
<h1 style="text-align:center"> Simple Map Examples</h1>
<div id="map"></div>
<h1 style="text-align:center"> Map with circle Examples</h1>
<div id="map1"></div>
</body>
</html>
Live demo
Go to this url
